

NAPLAN results have now been released in every state in the country, but many schools still wrestle with getting practical insights from the data in its raw form. In fact, 78% of teachers don’t believe NAPLAN results will help them identify student areas for improvement.
When used correctly, NAPLAN results can provide powerful insights that genuinely improve classroom performance, with the potential for personalised learning journeys for each student. Unfortunately, as most schools largely ignore NAPLAN in their planning, all of that data and information goes to waste.
To help bridge this gap, Bloum is rolling out new features this month to include automated NAPLAN insights. Staff members can simply let the platform perform its analysis and utilise its insights in the classroom. Our press release details more of these features.
The difficulty of interpreting NAPLAN results
The first roadblock using NAPLAN in the classroom revolves around interpretation — do you know what the results are saying?
Unfortunately, NAPLAN Scale Scores aren’t a simple dataset. Without context, a NAPLAN Scale Score doesn’t mean much by itself; it’s hard to determine if a Scale Score of 500 in reading is a positive or negative result. The only way to effectively evaluate Scale Scores is to compare them against school, state and national averages.
Additionally, when using the scale, it’s difficult to understand individual student growth between tests. Students usually become more confident and competent in their skills as they grow up, but how much improvement is expected?
A student who achieves a difference of 45 in reading Scale Scores between Year 3 and Year 5, for example, has achieved below-average growth, but the same difference between Year 5 and Year 7 can be considered very healthy progression.
Bloum works to address these challenges by maintaining a visually-friendly user interface that can be easily read by non data-native teachers. You can find a sample screenshot below:

Examples of NAPLAN insights
After a school can intelligently and efficiently interpret NAPLAN results at scale, what happens next? Are there useful insights that can be lifted out and reflected in the classroom?
The following examples show the potential for how powerful NAPLAN insights can be. These are gathered from the Grattan Institute Report in 2016 in affiliation with organisations including Google, PwC, Ernst & Young, Westpac, and many others.
While all classroom improvement must be eventually led by capable and enthusiastic teachers, it’s clear that NAPLAN results can truly improve a teacher’s understanding of their class’s performance.
In fact, what is sometimes lost in the NAPLAN conversation is how powerful the system can be — very few countries around the world have nation-wide, cohort-by-cohort data delivered via a standardised series of exams.
Student bands don’t show steady, consistent progress
Students do not maintain the same level of progression as they go through school. Most students in Year 3 attain a relatively close level of achievement to their peers, with 60% of them maintaining a 2.5-year range.
However, that range explodes out to 5.5 years by Year 9, and typically reaches a 7-year spread. The top 10% of students in Year 9 are about eight years ahead of the bottom 10%.
That makes the Year 9 classroom environment very difficult to manage for teachers, with no general ‘average’ to teach towards.
It also means students who are high achievers and low achievers can find the classroom unfair or unreceptive to their needs.
Low achieving students fall behind faster
So where does the widening gap come from? Unfortunately, research shows that much of it consists of a greater gap as low achievers fall further behind as they advance through school.
This idea can be difficult to see without understanding metrics such as Bloum’s new Years of Progress feature (see below), because the findings are counterintuitive.
The raw difference in NAPLAN Scale Scores suggests that the gap actually narrows between high and low achievers; low achievers gain 211 points between Year 3 and Year 9, while high achievers only gain 156 points.
However — in a nod to the difficulty of interpreting NAPLAN scores — a gain of 50 points represents different meanings for different Scale Scores.
Low achievers are 2.67 years behind their high-achieving peers in Year 3, but a further 12 months behind by Year 9 at 3.67 years in arrears. For more, see our Years of Progress metric below or in the press release.
Higher achievers in disadvantaged schools show the biggest learning gap
And in another concerning sign of the widening inequality gap, it’s bright students in disadvantaged schools that show the biggest loss in potential.
Students in disadvantaged schools who are high NAPLAN achievers in Year 3 will make approximately 2.5 years less progress than their similar peers in advantaged schools.
And the extent of this gap is highly worrying. Overall, from Year 3 to Year 9, these high achievers in disadvantaged schools actually make less progress (5.67 years) than low achievers in advantaged schools (6.83 years).
Importantly, the study does not suggest that staff members in disadvantaged schools are cutting corners or failing in their job.
Rather, the data should point to how further support is needed in disadvantaged schools to help close the gap.
How Bloum comes in
If schools can use the NAPLAN data at their disposal to draw these kinds of insights, they can implement powerful changes in the classroom. As such, we have developed these two new metrics to help teachers genuinely interpret and utilise NAPLAN data.
An important consideration was ease of use: during these past 20 months of pandemic-affected online learning, 75% of teachers worked more hours than usual, so they don’t need more data analysis on their plate.
As such, these two new user-friendly metrics will automatically help teachers interpret the standard NAPLAN Scale Score. In turn, this means teachers can help their students with personalised teaching that addresses their specific needs.
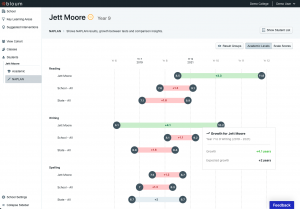
This image has been taken from the platform and features a sample student’s scores:
The Equivalent Year Level metric
The first new feature we’re rolling out is known as the Equivalent Year Levels metric. This converts any given Scale Score and shows you what year level the average student should be in to perform at this level. Using this approach, a teacher can instantly know whether their student is overperforming, underperforming, or performing as expected.
Here’s an example that illustrates the usage of the Equivalent Year Level:
Jett is in Year 9 and has achieved a NAPLAN Scale Score of 624in Reading. Using Bloum’s new feature, this score is translated to an Equivalent Year Level of 11.8. That means Jett’s writing skills are nearly two years more advanced than his peers.
His teacher Mrs Bloum is then able to take this knowledge and challenge Jett to read more difficult texts or chapters for homework. Without this metric, Mrs Bloum only knows that Jett is a bright student but cannot measure his true ability.
The Years of Progress metric
Complementing the new Equivalent Year Level rating, we have a Years of Progress metric that shows how many years of growth a student has achieved between NAPLAN tests. Schools commonly hope to guide one year of growth for one year of schooling, but an individual’s progression usually isn’t linear.
As above, an illustration can better explain the use of the Years of Progress metric:
Jett has also achieved a NAPLAN Scale Score of 586 in Writing, which represents an increase of 76 from his equivalent score in Year 7 of 510. According to the Years of Progress metric, this shows that Jett has improved by 4.1 years of growth over these exams, which far exceeds his expected growth of two years.
In fact, in Year 7, Jett was considered a below-average writer, but now he is approximately one year ahead of expectations.
Mrs Bloum is therefore able to recognise and reward him for his hard work over high school. Without this metric, it would have been difficult for Mrs Bloum to recognise Jett’s overperformance, because she had not taught him in Year 7 and Year 8.
About Bloum
Bloum is a learning analytics platform that interprets school data for your staff members, allowing non-data-savvy teachers to still enjoy the power of analytics and data. The platform actively pushes strategies and suggested recommendations for teachers to guide students, giving them the confidence to make data-driven decisions.
If you’re interested in learning more about how Bloum’s new NAPLAN features can help your school, talk to us today for a free demo of the platform.